How to analyze research graphs – a primer for SLPs
In the past, I used the abstracts of research papers to determine what the research was about and the results of the study. I naively assumed that abstracts would not be biased; they would not overexaggerate results or make claims that were not fully supported.
I didn’t come to these quick conclusions based on ill-intent or laziness. I simply had no idea how to read the articles or visually analyze the results.
Single Subject Research Design (SSRD) is a common type of research used in the fields of speech pathology. It is frequently found in applied research because it occurs in realistic settings with typical resources, generates a research question, and collects repeated and reliable measures of performance (Ledford & Gast, 2018). In addition, it allows the researcher/clinician the opportunity to analyze the results of small groups of participants and make treatment decisions (Ledford & Gast, 2018).
Today’s post is going to give you a few helpful hints as to how to visually read and analyze figures in SSRD. There are a set of procedures used when looking at the graphed results to evaluate patterns and assess if there is a relationship between the intervention and the outcome (Ledford & Gast, 2008). Ledford and Gast (2018) describe the advantages of using visual analysis to include:
- Visual analysis can be used in research involving individuals or small groups. Since speech therapy is typically done with individuals or small groups, this type of analysis is particularly applicable.
- Visual analysis is a dynamic process that is repeatedly collected, graphed and reviewed. Treatment-based decisions can be made depending on whether the intervention is showing therapeutic or non-therapeutic trends.
- Visual analysis focuses on individual data patterns and is therefore extremely useful for changing interventions for individuals, rather than for entire groups. This is useful when individuals are not responding well to an intervention and the interventionist tweaks the therapy to see if that produces data changes.
- Visual analysis allows the interventionist to notice unplanned findings that are not necessarily part of the main analysis. For example, in studying expressive language, one might find that certain semantic categories of words were used more often than others, although the researcher might be primarily studying MLU.
- Visual analysis can be interpreted by individuals without extensive statistical information or calculations.
There are three common figures (graphs) analyzed in SSRD: bar graphs, line graphs, and cumulative graphs (Ledford & Gast, 2018). Below you will find brief introductions and examples:
Bar graphs
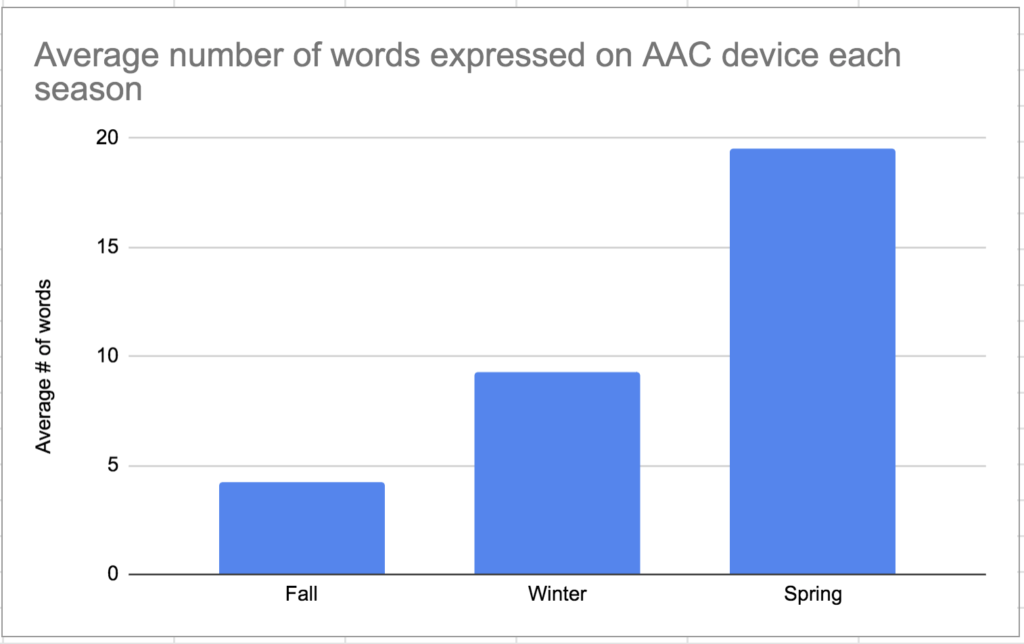
Bar graphs are useful for comparing two categories of data. These can be used with means and blocks of time, such as the total number of words initiated on an AAC device in each season of the school year. In the figure below, you can easily see that the mean number of initiated words increases each season. This graph is typically very easy for readers to understand.
Line graphs
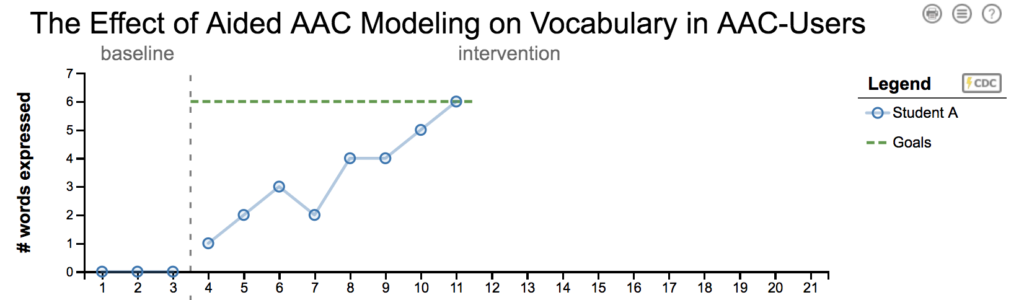
Line graphs represent data over time; they display continuous data often measured by date or session. They are especially useful for clinicians and applied researchers to analyze and adjust interventions to be more effective. In the example below you can see that after the intervention was introduced (vertical dotted line), student A’s number of words increased immediately, and then demonstrated a positive trend towards the goal line. The goal was reached in the 11th session after six treatment sessions.
Cumulative graphs
Cumulative graphs demonstrate progress towards goal mastery as a cumulative measure. For example, one of my goals for this year was to run 500 miles. If I graphed in a cumulative method, you would see my data slowly climbing slowly towards that goal until I reached it. The research that I am focused on does not include cumulative graphs, however, I brainstormed a possible use within my school-based therapy. I could decide that rather than using percentages, I want my student to produce 1000 good /r/s in words before I move to sentences. I may not even be counting inaccurate /r/ sounds, just accurate productions as a tally. After my student reaches this goal, the intervention, and data that I am measuring could change to producing 1000 good /r/ sounds in sentences. Scroll the bottom of this page to see an example.
I hope this information is helpful and that you can apply it to any research that you read. Don’t just skim the abstract. Look at the data and the graphs and draw your own conclusions. Did the intervention work? If it did, reach that paper in detail so that you can learn more about effective interventions and how to imitate them in your own setting!
Resources
Ledford, J. R., & Gast, D. L. (2018). Single case research methodology: Applications in special education and behavioral sciences. Routledge.